


Driving While Black: Distinguishing Fact From Fiction
The existing body of evidence reveals substantial geographic heterogeneity in the presence of racially biased traffic enforcement.

Table of Contents
Introduction
The “Driving While Black” hypothesis posits that Black drivers are held to a higher standard of behavior than White drivers by police officers. Put differently, it asserts that Black drivers are more likely to be subject to police scrutiny when compared to White drivers engaged in the same behaviors.1
This hypothesis has gained considerable attention in light of two observations:
Traffic stops have precipitated high-profile cases of police use-of-force involving Black civilians (Smith 2017).2
Traffic enforcement fines have meaningful negative impacts on the financial stability of lower-income drivers (Mello 2023).
This essay reviews the existing body of social science literature to examine the degree to which the “Driving While Black” hypothesis holds true.
Driving Speed Analyses
Driving speed analyses examine whether officers are racially biased in the decision to issue speeding tickets by measuring the actual speed at which drivers from a given racial group travel. Researchers can obtain information regarding the actual speed at which drivers travel from a variety of objective sources (e.g. speed-triggered cameras). These objective data sources can then be leveraged to assess whether officers are ticketing drivers of a particular race in proportion to the rate at which they actually violate speeding laws.
Though this method relies on objective sources of speeding data, it will yield misleading results if the set of civilians encapsulated by an objective source of speeding data is unrepresentative of the set of civilians with whom police interact. To see why, consider a case in which speed-triggered cameras and officers are located within geographically distinct regions of a city.

If the racial composition and/or behavior of drivers differ meaningfully between the regions in which speed-triggered cameras and officers are located, it would no longer be fair to compare the ticketing practices of officers to the cameras since they would be observing two fundamentally different civilian populations.

Thus, researchers must take great care to ensure that analyses involving objective sources of speeding data rely on apples-to-apples comparisons which control for differences in geography and time-of-day, among other variables.
Lange, Voas, and Johnson (2005):
This study examines racial bias among officers who issue speeding tickets along the New Jersey Turnpike. By placing 14 speed-triggered cameras along the segments of the turnpike, the authors gather roughly 38,000 high-resolution photographs of drivers on the road between March 31, 2001 and June 30, 2001. To ascertain the race of a driver from a given photograph, two members from a panel of three trained individuals must agree on the race of the driver.3 The panel members were selected after they demonstrated success in correctly identifying a given driver’s race in a prior study (i.e. the panel member’s assessment frequently concurred with the driver’s self-reported race). The panel members were also blinded to the speeding behavior of the driver to reduce the risk of bias. The authors define “speeders” as drivers who traveled at least 15 miles-per-hour above the speed limit as documented by the speed-triggered cameras. They chose this speeding threshold on the following grounds:
Our decision to define speeders as those traveling 15 mph or more above the posted speed limit was based on discussion with representatives of the New Jersey State Police. A conclusion was reached that 15 mph above the limit reflected a speed at which most State Troopers would initiate a traffic stop.
The authors then obtain data regarding 30,000 traffic stops conducted by New Jersey State police officers between March 31, 2001 and June 30, 2001. Because the speed-triggered cameras were designed only to detect speeding violations, the authors discard all traffic stops conducted for reasons unrelated to illegal movement of the vehicle.4
To evaluate the presence of racial bias, the authors compare the racial composition of speeders identified by the cameras to the racial composition of individuals stopped by police for moving violations. They perform these comparisons within a given timeframe and geographic segment of the turnpike to approximate an apples-to-apples comparison. The results of this comparison are as follows:

Two general trends are worth noting:
The share of speeding individuals that are Black closely resembles the share of individuals stopped by police for moving violations that are Black. For example, the former metric is 22.7% and the latter metric is 23.8% for the 12-4 PM x Southern/Central segment of the dataset. Thus, Black drivers are stopped proportionately to their rate of speeding behavior.
The share of speeding individuals that are White typically exceeds the share of individuals stopped by police for moving violations that are White. For example, the former metric is 68.2% and the latter metric is 58.0% for the 12-4 PM x Southern/Central segment of the dataset. Thus, White drivers are under-stopped relative to their rate of speeding behavior.
Taken together, these findings indicate that racial bias in traffic enforcement operates primarily through officers displaying undeserved lenience towards White drivers.5 Given this result, one might be surprised to learn that this study is mistakenly invoked as irrefutable evidence against the “Driving While Black” hypothesis. This confusion likely stems from the authors’ odd interpretation of their own data. They state:
The distribution of Black and White speeders over time approximate closely the pattern of police stop rates.
It’s genuinely unclear how the authors arrived at this interpretation regarding White speeders. Ideally, they would have performed some kind of statistical inference to determine whether the share of speeding individuals of race X statistically significantly differs from the share of individuals stopped by police for moving violations of race X, but the authors perform no such inference. Given this omission, it’s hard to see how one could possibly reach the conclusion that the White share of speeders “closely approximates” the White share of stopped drivers.
The authors do later perform statistical inference using a model that predicts driving status (speeding vs non-speeding) as a function of race, age, and sex:
Black drivers were 64 percent … more likely to speed (as defined by traveling 15 mph or more above the posted speed limit) than White drivers in 65 mph zones.
But this fact alone cannot conclusively indicate anything about racial bias for two reasons. The first reason is that the existence of racial bias is a question of proportionality, not mere incidence. Thus, the relevant question to ask is whether a particular racial group is stopped in proportion to the rate at which they commit speeding infractions, not which racial group is more likely to commit an infraction in the first place. The second reason is that racial bias can operate through one of two mechanisms: (1) police may over-stop Black drivers (2) police may under-stop White drivers. While the study demonstrates that the former mechanism is not at play, it does demonstrate that the latter mechanism clearly is. Thus, the study lends support to the claim that Black drivers are held to a higher standard of behavior than White drivers.
One criticism of this study that bears mentioning is social desirability bias: a phenomenon where subjects’ awareness of research conditions leads them to modify their behavior to produce socially acceptable results. Because the study was conducted in collaboration with representatives of the New Jersey State Police as part of a consent decree, officers were likely aware that they were under scrutiny and changed their behavior as a result. Social desirability bias would then lead to an underestimation of racial bias because the behavior that officers exhibited during the study period would be unrepresentative of the behavior they exhibited outside the study period.6
Regardless, the existence or absence of social desirability bias doesn’t change the fact that White drivers were under-stopped relative to their speeding behavior. Thus, the most plausible interpretation of the study remains consistent with the “Driving While Black” hypothesis.
Cai et al (2022):
Telematics broadly refers to technologies which sit at the intersection of telecommunications and informatics - who would’ve guessed! Using telematics, researchers can document the latitude-longitude coordinates of a driver over a given set of points in time which, in turn, renders it possible to compute the speed at which drivers travel. The present study gains access to telematics data for over 25 million vehicle trips which take place across police beats in 10 different cities. Within a given police beat, the authors compute the total driving time, the share of non-White residents, and the share of total driving time spent traveling at least 9 mph above the speed limit (hereby referred to as the “speeding fraction”).
The authors then model the number of speeding stops within a given police beat as a function of the aforementioned variables: total time spent driving, speeding fraction, and share of non-White residents.7 By averaging the results across beats within a given city, they can compute the city-wide effect of a greater non-White resident share on the number of speeding stops, controlling for rates of speeding behavior. The final results reveal substantial heterogeneity in the effect of beat-specific racial composition on the number of police stops for speeding.
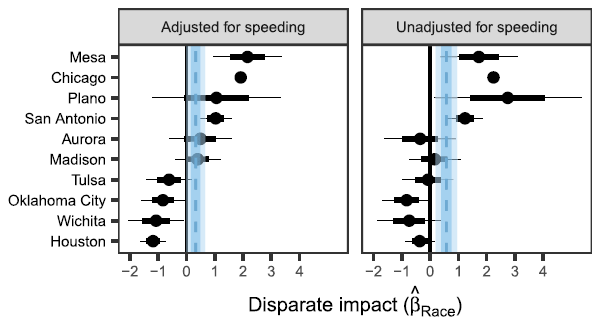
To place the measurements above in context, one can compute the percent change in the average number of speeding stops associated with moving from a 75% White beat to a 75% non-White beat in the same city like so:8
Thus, the study has the following wide range of findings:
Moving from a 75% White beat to a 75% non-White beat in Mesa, Arizona is associated with an 195% increase in the number of speeding stops after controlling for speeding behavior and time spent driving.
Moving from a 75% White beat to a 75% non-White beat in Houston, TX is associated with a 45% decrease in the number of speeding stops after controlling for speeding behavior and time spent driving.
These results clearly indicate that racial bias in traffic enforcement varies substantially across the country, rendering the “Driving While Black” hypothesis true or false depending on the geographic context. But before leaving with this takeaway, several criticisms of the study are worth considering.
The study doesn’t have access to the race of individual drivers. Thus, it could be possible that police stops within White neighborhoods may actually be of Black drivers due to a kind of “outlier” effect (i.e. Black drivers are more noticeable in White neighborhoods).
Though this theory initially sounds plausible, the authors demonstrate that there exists a strong correlation (r=0.83) between the share of non-White residents in a police beat and the share of non-White speeding stops conducted by police. If outlier effects were substantial, we would expect to see just the opposite because the racial composition of stopped drivers would not be representative of the beat in which the stops took place. However, it’s worth mentioning that the authors exclude police beats with highways, airports, lakes, and other nonresidential areas because these beats may involve sets of drivers who are racially unrepresentative of the residents within the beat. Thus, an outlier effect could theoretically manifest within these types of locations.
The study uses a speeding threshold of traveling at least 9 mph above the speed limit. But officers might only initiate stops at much higher thresholds. It might even be the case that the speeding threshold an officer uses is relative to the speed limit posted.
To address this criticism, the authors neatly demonstrate that their primary results hold when using a number of speeding thresholds between 6 mph and 18 mph above the posted speed limit. Even when using relative speeding thresholds between 10% and 90% above the posted speed limit, the results remain unchanged.
The study lumps all non-White drivers into a single category which masks meaningful differences in levels of racial bias experienced by Black, Hispanic, and Asian Americans.
This criticism is fair and highlights a common, but frustrating, methodological choice to treat all non-White groups as though they experience they same type and intensity of discrimination at the hands of police. There are a variety of sound reasons why researchers might make such a choice - parsimony, statistical power - but such choices unfortunately muddle the conclusions that can be drawn from the study.
Couldn’t disproportionate enforcement of speeding tickets in non-White neighborhoods be due to greater levels of (non-speeding) crime in these neighborhoods? Higher levels of crime would increase police presence in a way that would necessarily increase enforcement of speeding laws even if non-White communities aren’t that much more likely to speed than White communities.
This is certainly a plausible hypothesis, but it’s difficult to assess within the confines of this study. You might be thinking to yourself, “Couldn’t the authors have just included controls for beat-level crime rates to account for the increased deployment of officers to high-crime neighborhoods?” but this methodology simply won’t suffice. Controlling for beat-level crime rates assumes that the crime rates reported by local police departments are themselves unaffected by racial bias. But such an assumption undermines the entire purpose of the study. If your goal is to determine whether officers are racially biased in their assessments of criminality, why rely on data which already presumes an answer to that question?
This fact should not be taken to mean that there is no conceivable way to control for increased deployment of officers to high-crime communities. One metric that can be leveraged for such a task is the frequency of civilian-initiated calls-for-service (e.g. 911 calls). Because these calls are effectively invitations for police to patrol crime in the community, they would serve as a proxy for criminal behavior that would be unaffected by the racial bias of police officers. Controlling for the frequency of calls-for-service would then successfully account for the increased deployment of officers to high-crime neighborhoods.9
Couldn’t disproportionate enforcement of speeding tickets in non-White neighborhoods be due to local governments relying on speeding fines as a meaningful source of revenue?
This is definitely a plausible hypothesis and provides a strong reason to distinguish between interpersonal racism and structural racism. The “Driving While Black” hypothesis is fundamentally a claim about interpersonal racism: it hinges on the notion that police officers hold individual Black drivers to higher standards of behavior than comparable White drivers. However, the fine-reliant governments hypothesis is fundamentally a claim about structural racism: it hinges on the notion that a history of racial segregation and disinvestment in Black neighborhoods has led local governments within such neighborhoods to become overly dependent on punitive measures for financing.
One could identify which of the two hypotheses is at play by controlling for the share of local government financing that originates from punitive measures. The truth of the “Driving While Black” hypothesis would then rest on the results of such an analysis.
When taking the above criticisms into consideration, the study has a fairly unclear interpretation. It highlights substantial geographic heterogeneity in the relationship between racial composition of neighborhoods and enforcement of speeding laws after accounting for neighborhood-level speeding behavior. But even when focusing solely on cities where disproportionate enforcement of speeding laws in non-White communities is readily apparent, it’s difficult to determine whether this disproportionality is driven by interpersonal racism, structural racism, or increased deployment of police officers for crimes other than speeding.
Aggarwal et al (2022):
Anyone who’s used a ride-share service should be familiar with the feeling of seeing your driver’s location in real-time (and frantically rushing to meet them to ensure your money doesn’t go to waste). Ride-share companies are able to share such information with users by relying on high-frequency data emitted by the mobile devices of drivers. Importantly, this high-frequency data can also be leveraged by researchers to compute the real-time speeds at which drivers travel immediately prior to being stopped by police officers.
A team of economists at Lyft and various universities partnered together to examine the extent to which racial bias manifests in officer’s decisions to issue speeding citations and fines in the state of Florida. The initial dataset spans over 40 billion observations from August 2017 to August 2020.10 However, the authors reduce the dataset to 20 million observations via random sampling for computational reasons. Race is treated as a binary variable: minority (Black, Hispanic, Asian, Pacific Islander) or non-minority (White). The authors then use two different statistical models to estimate the prevalence of racial bias.
The mathematical details of these models are not necessary to discuss here. Rather, there are two simple facts about both models that one should be familiar with:
Both models control for driving speed, time (hour of day, day of week, month of year), geography (area where stop took place), vehicle characteristics (age), road characteristics (amount of traffic, number of lanes), and driver characteristics (age, gender).
The underlying assumption of both models is that controlling for the aforementioned variables should eliminate any differences in speeding citations/fines that are justified by racial differences in driving characteristics.
The models yield the following conclusions:
We find that minority drivers are 24 to 33 percent more likely to receive a speeding ticket for traveling the exact same speed as white drivers. These differences amount to minority drivers paying 23 to 34 percent more in fines for the same level of speeding as white drivers. Importantly, both of these differences are highly statistically significant.
There are several reasons to view this study as the most rigorous examination of racial bias in traffic stops to date:
The study does not suffer from social desirability bias because officers were not aware that their behavior was being examined/documented by Lyft.
The study is able to connect Lyft’s information regarding driver’s name and birthdate to self-reported race from state voting records, ensuring that the documentation of race is highly accurate (i.e. it does not suffer from officers intentionally misreporting driver’s race to avoid allegations of racial bias).
The study makes use of a rich set of controls to account for non-racial reasons that could otherwise explain disparities in speeding citations and fines.
The study computes the real-time speed at which drivers were traveling immediately prior to being stopped by a police officer. This methodology stands in contrast to other studies which measure speeding behavior and officer stops at separate times and places.
The study rules out the possibility that racial disparities in citations/fines were attributable to racial differences in propensity to become involved in traffic accidents and propensity to reoffend.
However, there are a few criticisms worth considering.
Couldn’t it be the case that minority-race drivers are more likely to be ticketed/fined because certain characteristics of their car not captured by researchers do capture the attention of police officers (e.g. having a banged up or dirty car)?
This mechanism is theoretically possible but would clearly be at odds with the Lyft business model. Because factors such as a dingy/dirty car would presumably affect a driver’s ability to solicit passengers (through negative passenger ratings), it seems to me that very few vehicles in the dataset would actually exhibit these kinds of erratic characteristics. Thus, to the extent that any vehicles in the dataset were visibly banged up/dirty, I would speculate that the primary results would remain qualitatively unchanged.
Lyft drivers are probably safer and have better-maintained cars than the average driver. If this assumption is true, then the study’s conclusion of racial bias can’t be generalized to the broader population of minority-race drivers.
This is unfortunately a limitation of the study. While the researchers are able to control for a rich set of variables that might otherwise explain the racial disparity in speeding tickets/fines, this procedure comes at the expense of generalizing the study to the broader population.11 However, we shouldn’t take this reduction in generalizability to imply that the study is of little empirical value. There are millions of drivers for whom the ride-share sector is a sizeable source of income, and any kind of ticket/fine that they receive could meaningfully damage their ability to make a living. Thus, racial discrimination in this domain has a greatly increased significance.
It seems like there are a lot of alternative choices the authors could have made that may have swayed the outcome of the study. Perhaps the random subset of the data they chose to analyze just happened to indicate racial bias. Perhaps the threshold they used to measure reoffense rates was too low or too high. Perhaps the results heavily depend on the criteria they used to merge Lyft high-frequency data with state data regarding police stops. Given that the results may be sensitive to all of these choices, how can we have much certainty in the final finding?
It’s worth noting that the study is a working paper, meaning it’s been disseminated specifically to solicit commentary and feedback from other researchers prior to publication. I would guess that, when the paper ultimately does become published, the authors will likely include a number of additional robustness checks to ensure that the primary results are not sensitive to the particular methodological choices described here. Regardless, this criticism seems like nitpicking to me because (1) the empirical strategy employed by the study stands on its own merits (2) the authors re-estimate the degree of racial bias under different methods of merging Lyft data with police data and find that the results remain quantitatively similar.
Conditional on the results of further robustness checks, this study provides strong evidence in favor of the “Driving While Black” hypothesis specifically in the context of Lyft drivers.
Quintanar (2017):
In October 2007, the city of Lafayette, LA began utilizing mobile vans with mounted speed-triggered cameras to enforce speeding laws. The introduction of these cameras rendered it possible to compare the ticketing practices of police officers against an objective benchmark.
The author leverages two datasets, each of which documents driver’s race differently:
The Lafayette City Court database contains information on all speeding tickets issued by the Lafayette police department within the city limits. The driver’s race is reported by the officer who wrote the ticket.
The Lafayette Consolidated Government maintains an automated database which is populated with all tickets issued by mobile vans. The driver’s race is identified by manually inspecting the photos taken by the speed-triggered cameras mounted on the vans. Because manual inspection is time-consuming and requires decent lighting conditions, the author randomly samples 15% of the tickets in the database which occurred between 6:00 AM and 6:59 PM.
Obviously, the mobile vans and police officers cannot observe the exact same subset of the civilian population, for if this was the case, the former form of traffic enforcement would be rendered next-to-useless by the latter (or vice versa). Because the civilian population encountered by the mobile vans and officers are different, the author controls for the following variables when comparing the ticketing practices of the two: zip code, time of day, whether the ticket was issued during the first half of the month, whether the ticket was issued during rush hour (morning or evening), whether the ticket was issued on the weekend, and the type of road where the ticket was issued (main road vs neighborhood street).
The author argues that anti-Black discrimination occurs if the following mathematical condition is met:
We can translate the above statement like so:
Let p represent the probability that a ticketed person is Black given that they were ticketed by a police officer.
Let q represent the probability that a ticketed person is Black given that they were ticketed by a camera.
If p > q after controlling for characteristics of the ticket (e.g. severity of speeding), then anti-Black discrimination occurs.
The study found no significant difference in the probability of ticketing a Black driver between mobile vans and police officers conditional on equivalent ticket characteristics. Thus, it provides little reason to think that officers are over-stopping Black drivers for speeding. Interestingly, a separate analysis did find evidence of gender bias against women stopped for speeding violations.
I suspect that one could argue against this interpretation of the study by pointing out that the author conducts a secondary analysis which does find evidence of racial bias:
The regression results including daylight controls are presented in Table 5, which support the previous results and imply that African-Americans and females are more likely to receive a ticket from a police officer only when race or gender is visible.
However, there are three problems with appealing to the author’s secondary analysis to support a claim of racial bias:
The secondary analysis relies on an empirical strategy known as the veil-of-darkness test. This test suffers from a number of methodological problems, all of which are described later in this essay.
The evidence of racial bias produced in the secondary analysis rests critically upon a finding that’s only marginally significant (i.e. a finding that is significant only at the 10% level).
The secondary analysis fails to control for road type. This omission is critical because the inclusion of the road type variable caused the first analysis to produce no evidence of racial bias.
With that being said, the study does leave open the question of whether officers exhibit undeserved leniency towards White drivers because it doesn’t evaluate the mathematical relationship below:12
Internal Benchmarking
Internal benchmarking refers to a set of techniques which identify the existence of racial bias by comparing officers’ behavior to one another. These techniques exist in a variety of forms: some compare an officer’s behavior to that of other officers while other techniques compare an individual officer’s behavior to their own behavior in alternative circumstances.
Goncalves and Mello (2021):
In the state of Florida, police officers issue an additional $75 fine for drivers who travel 10 mph above the speed limit. Because of this penalty jump, officers are commonly believed to exhibit lenience, lowering the reported speed at which a driver travels on the corresponding ticket to ensure that the driver isn’t fined. This manipulation of speeding tickets leads to an artificial “bunching” effect for drivers traveling at 9 mph above the speed limit as shown below:
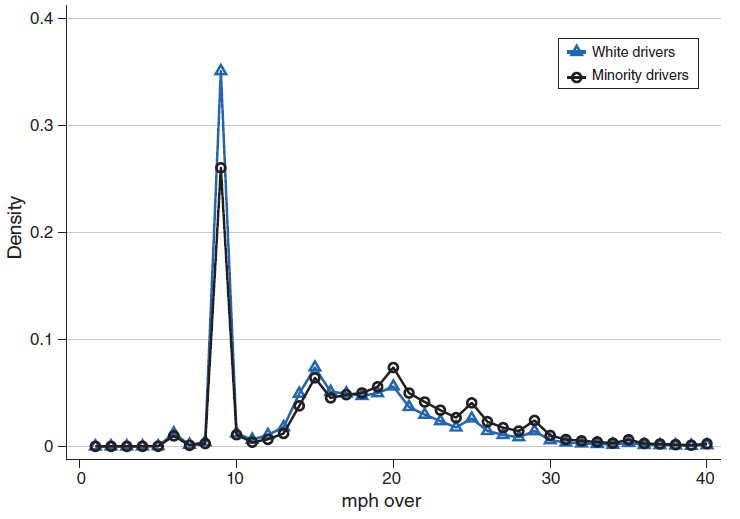
Importantly, the above figure reveals that such “bunching” is more prominent for White drivers than Black/Hispanic drivers. This “bunching” could reflect one of two hypotheses:
The Differential Offending Hypothesis: Black/Hispanic drivers are more likely to drive at least 10 mph above the speed limit than White drivers.
The Discriminatory Treatment Hypothesis: Police officers are less likely to downgrade the speeding violations of Black/Hispanic drivers relative to White drivers.
To discern which hypothesis is most consistent with the data, the authors use the behavior of non-lenient officers as a benchmark. The term “non-lenient officer” refers to an officer who does not have a tendency to downgrade speeding tickets to 9 mph above the speed limit. Put differently, non-lenient officers do not issue an artificially high number of tickets just at the 9 mph speeding threshold. The authors find that roughly one-third of officers are non-lenient under this definition.

The underlying assumption of the study is that the driving speeds reported by non-lenient officers reflect the true speeds at which drivers were traveling because these officers appear to be unaffected by incentives to manipulate reported driving speeds. Bearing this assumption in mind, the authors differentiate between the “differential offending” and “discriminatory treatment” hypotheses in the following manner:
The authors compute the true racial differences in speeding behavior between Black/Hispanic and White drivers by relying on non-lenient officers’ documentation of the speeds at which drivers of each group travel.
The authors compute reported racial differences in speeding behavior between Black/Hispanic and White drivers by relying on lenient officers’ documentation of the speeds at which drivers of each group travel.
The authors then compute the difference between the above differences to yield an estimate of discriminatory behavior that controls for the true racial differences in speeding behavior.
This methodology yields the following conclusion:
White drivers are 5.8 to 6.5 percentage points more likely to receive a discount than minority drivers, relative to a mean probability of 41.6 percent for lenient officers.
The authors’ methodology also enables them to compute the degree of discrimination exhibited by each officer in the dataset. The roughly one-third of officers who are non-lenient are assumed to exhibit no discrimination against drivers because the speeds they document are assumed to reflect the true speeding distributions of Black/Hispanic and White drivers. When focusing on the subset of lenient drivers, the authors find that 60.3 percent (±1.7) practice discrimination against Black/Hispanic drivers while 12.1 percent (±1.1) practice discrimination against White drivers. These findings compellingly indicate a greater level of lenience extended towards White drivers. But before leaving with this conclusion, there are several criticisms worth considering.
The authors seem to be assuming that the “bunching” effect is an unnatural phenomenon. However, couldn’t it be the case that drivers are aware of the higher speeding penalties associated with driving 10 mph above the speed limit and are naturally reacting to these penalties by lowering their speed just below the threshold?
The basic problem with this argument is that it can’t explain the behavior of non-lenient officers. The authors demonstrate that there is little correlation between the location/time of speeding stops and whether the officer is lenient or non-lenient. Given that the both non-lenient and lenient officers are encountering motorists in similar regions at similar times, why would it be the case that non-lenient officers are reporting vastly fewer speeding stops at 9 mph above the speed limit than lenient officers?
Another point worth mentioning is that the costs of discriminating via leniency (e.g. downgrading a speeding violation) are far less than the costs of discriminating via harshness. If officers discriminatorily antagonized civilians, civilians would submit inquiries to the police department and possibly force the department to enter into costly litigation. But if officers discriminate against civilians via leniency, the civilians who are discriminated against cannot actually know that they have been subjected to unfair treatment, reducing the odds that they would ever file inquiries or lawsuits against the department. Thus, it’s perfectly sensible to think that officers are more susceptible to engaging in discrimination via leniency in favor of White drivers.
The authors’ results imply that 38.4 percent (±4.7) of lenient Black officers practiced discrimination against Black/Hispanic drivers. But isn’t it incoherent to claim that Black officers can racially discriminate against Black drivers?
This line of questioning seems to exhibit a misunderstanding of what discrimination is. Neil and Winship (2019) define discrimination in the following manner:
We define an interaction as discriminatory if similarly situated individuals of different races are treated differently. Similarly situated refers to similarity in contextual, behavioral, and individual-level features. The strong assumption here, discussed further below, is that similarly situated individuals have equal probabilities of being engaged in criminal behavior and thus should be treated similarly.
Notice that “similarly situated” is taken to refer to the behavior of the individual at risk of being stopped rather than the characteristics of the officer themselves. Thus, it is perfectly coherent to state that a Black officer can discriminate against a Black driver. All that’s required to support a claim of discrimination is that an officer treat two individuals with equal criminality differently on the basis of race.13
With that being said, Black officers are the least likely to engage in anti-Black discrimination relative to other officers.

Thus, the behavior of Black officers is consistent with a process where officers are less likely (though not completely immune) to exhibit discrimination against drivers of their own race.
Couldn’t officers be less lenient to Black drivers because Black drivers are more likely to be repeat-offenders of speeding laws?
The authors control for the number of previous tickets issued to drivers.
Couldn’t this discrimination be explained by the fact that drivers who plead with an officer are more likely to have their speeding violation downgraded?
The authors explore this hypothesis by focusing on drivers who can be linked across multiple speeding tickets. Because these drivers have received multiple tickets, the authors are able to compute a “driver fixed effect” for each driver. This effect represents the set of characteristics innate to a given driver that manifest across all of their tickets (e.g. their propensity to plead with an officer). The authors find that the inclusion of this driver fixed effect explains a negligible amount of variation in police’s probability of downgrading a ticket.
Couldn’t the authors be underestimating the existence of discrimination since they don’t take into account the possibility that some White drivers may not even be stopped at all for engaging in the same type of speeding behavior as Black drivers? If Black drivers are more likely to be stopped for traveling at low speeds than White drivers, they would also be more likely to have their ticket downgraded during the speeding stop. The share of Black drivers with a downgraded speeding ticket would then increase not because of lessened racial bias but instead due to racial bias at an earlier stage of the police-civilian interaction.
This criticism is worth taking seriously because Aggarwal (2022) finds compelling evidence of racial bias in the decision to stop minority-race Lyft drivers in the state of Florida. The authors tackle this criticism by using a statistical procedure known as a Heckman correction. The mathematical details are too complex to outline here, but the basic idea behind this correction is to model both the process of being stopped and the process of having a downgraded speeding ticket. By modeling both processes together, the authors can calibrate their estimate of racial bias to account for the possibility that Black drivers are more likely to be stopped in the first place. Employing the Heckman correction does not modify the primary findings.
Couldn’t the authors be overestimating the existence of discrimination since they don’t take into account the possibility that some officers might just let Black/Hispanic drivers go if they are sensitive to the fact that these drivers might be disproportionately burdened by a speeding ticket relative to White drivers? If this scenario occurs, the lower “bunching” for Black/Hispanic drivers would simply be a byproduct of officer leniency displayed earlier in the interaction with such civilians.
The underlying assumption of this critique seems to be that officers intuit a person’s socioeconomic status from their race. They then use this inference to avoid giving lower-income (and disproportionately Black/Hispanic) people tickets because they’re aware that issuing tickets to lower-income people is more likely to burden them down the road. Thus, the reason that fewer Black/Hispanic people show up as receiving tickets at 9 mph above the speed limit is because they’re more likely to be let off with just a warning (and no recorded ticket) in the first place.
Though this explanation is theoretically possible, it suffers from the fact that the authors include a number of controls for socioeconomic status, many of which should be directly observable to the officer. The authors control for age, age squared, prior incarceration, log average income of the driver’s home zip code, the vehicle age, the vehicle age squared, estimated vehicle price, and vehicle make. Perhaps it’s just my opinion, but it seems highly implausible that officers think a Black/Hispanic driver with the same age, neighborhood income, incarceration history, and vehicle as a White driver is in more need of sympathy (and less in need of a speeding ticket) due to the perceived burden a ticket might constitute for them.
Because none of the criticisms described pose a threat to the integrity of the study, the conclusion that officers are more likely to downgrade speeding tickets of White drivers remains unchanged.
Grosjean, Masera, and Yousaf (2023):
Using data on 35 million traffic stops and 221 Trump rallies conducted between 2015 and 2017, this study examines whether the probability of a traffic stop of a Black driver increases in the immediate aftermath of a Trump rally. To borrow terminology from randomized controlled trials, the “treatment” group of the study consists of counties which hosted a Trump rally within a given 30-day window whereas the “control” group of the study consists of counties which did not host a Trump rally within the same 30-day window. The authors discover that the probability of a traffic stop of a Black driver increases by 5.74% in the 30 days following a Trump rally. But before hastily concluding that this finding supports the “Driving While Black” hypothesis, they examine a number of alternative hypotheses that could be consistent with this finding.
Could reverse causality not be at work here? It might be the case that the counties which host Trump rallies are systematically different from the counties which don’t.
Reverse causality is an unlikely explanation because the authors control for characteristics of a county that remain unchanged over time (e.g. prevalent cultural attitudes within the county) using county fixed effects.
Couldn’t racial differences in driving behavior be driving (pun intended) these results?
The authors address this hypothesis in three manners. They gather traffic fatality data from the Fatality Analysis Reporting System (FARS), data regarding police stops following a collision, and data regarding speeding violations that were recorded by police who used radar guns. They find that none of the three aforementioned events see significantly increased involvement from Black civilians in the aftermath of a Trump rally. Given that involvement of Black civilians in traffic fatalities, vehicle collisions, and speeding violations remain unchanged following a Trump rally, differences in driving behavior are an unlikely explanation for the authors’ findings.
Couldn’t it be the case that officers were simply more vigilant - regardless of race - on the day of or following Trump rallies and non-Black drivers reacted by spending less time on the road?
This likely isn’t the case because the racial composition of drivers involved in traffic fatalities did not change following Trump rallies. Thus, there is little reason to believe that non-Black drivers spent less time on the road following Trump rallies. Furthermore, the authors control for changes in police activity that occur on the day of the Trump rally.
With the above alternative hypotheses refuted, the authors then demonstrate that the primary cause of the increase in traffic stops of Black drivers is the racially inflammatory rhetoric associated with Trump rallies. They explore this mechanism by computing three measurements of racial attitudes:
Officer-level racial bias is measured by examining whether an officer is much more likely to issue an arrest or warning to a Black driver relative to their colleagues in the same county, on the same day, at the same time.
County-level racial bias is measured through survey responses to questions regarding race, the cotton suitability of the county (which serves as a proxy for the historical prevalence of slavery), and the frequency of lynchings and executions of Black civilians between the Civil War and World War II.
Race-related Trump speeches are measured by the frequency of explicit references to race (e.g. “race,” “racial,” “racist,” “Black,” “African”) and possible racial dogwhistles (e.g. “drug,” “crime/criminal,” “gun,” “prison,” “rape,” “riot,” “thug,” and “urban”).
The authors demonstrate that the increase in the probability of traffic stops of Black drivers in the aftermath of a Trump rally is most pronounced for officers and counties with high levels of racial bias. Interestingly, Trump rallies with both implicit and explicit references to race only increase an officer’s probability of stopping a Black driver if the officer already scores highly on measures of racial-bias. This finding suggests a kind of priming effect whereby only officers with pre-existing racial biases change their stop behavior following Trump rallies.
Importantly, non-racial county characteristics (e.g. vote share for Obama in the 2012 election) and the frequency with which Trump rallies mention non-race-related issues (e.g. manufacturing declines) do not mediate the effect of these rallies on the probability of stopping Black drivers. Thus, the explanation most consistent with the available data is that racially inflammatory rhetoric from Trump rallies induces officers with pre-existing racial biases to modestly increase the rate at which they initiate traffic stops of Black drivers, lending credence to the “Driving While Black” hypothesis.
West (2018):
One of the most challenging components to studying racial bias in policing is officer discretion. Because datasets typically only contain information regarding the set of traffic stops that officers chose to initiate and report to the department, it’s possible for resulting analyses of these datasets to suffer from selective reporting.
This study overcomes the issue of selective reporting by examining automobile crash investigations to which police are automatically dispatched (i.e. police departments cannot choose whether to investigate crashes reported by civilians). The author demonstrates that, for a given geographic region, the race of the officer dispatched to a vehicle crash is effectively random, ensuring that non-White and White officers encounter drivers with an equal risk of engaging in citation-worthy behavior.14 This fact can be leveraged to compute the degree of own-race bias exhibited by officers while citing drivers during crash investigations.
The author initially considers, but rejects, the following two strategies that compute estimates of officer own-race bias.
Incorrect Strategy #1: If White officers are more likely to cite non-White civilians than White civilians, White officers exhibit own-race bias.
The problem with this strategy is that it fails to control for racial differences in driving behavior. If Black drivers are ultimately more culpable for crashes than White drivers, the strategy would assert the existence of racial bias where none exists.
Incorrect Strategy #2: If White officers are more likely to cite non-White civilians than non-White officers are likely to cite non-White civilians, White officers exhibit own-race bias.
The problem with this strategy is that White officers could just be more punitive regardless of race compared to non-White officers. Thus, White officers would be more likely to cite both non-White civilians and White civilians relative to non-White officers.
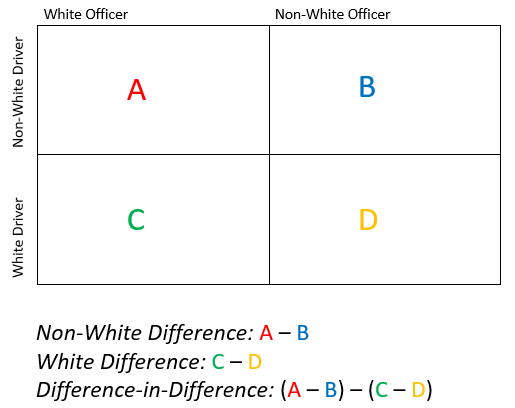
To overcome the issues with the above strategies, the author proposes the following difference-in-differences strategy:
Non-White Difference: Compute the difference between White officers’ probability of citing a non-White driver and non-White officers’ probability of citing a non-White driver.
White Difference: Compute the difference between White officer’s probability of citing a White driver and non-White officers’ probability of citing a White driver.
Difference-in-Differences: Compute the difference between the non-White difference and the White difference to yield an estimate of officers’ own-race bias.
The difference-in-difference strategy can be described graphically as well:
Now you might be thinking to yourself:
How the heck does this strategy estimate racial bias?
Recall that non-White drivers encountered by non-White officers and White officers have an equivalent risk of citation-worthy behavior because the race is the dispatched officer is random. Thus, the probability of citing a non-White driver should be equivalent between non-White officers and White officers … unless White officers are simply more punitive regardless of race.15
But if officer punitiveness (and not own-race bias) explains this result, then the magnitude of the non-White difference should be equivalent to the magnitude of the White difference. Put another way, the increased punitiveness exhibited by White officers relative to non-White officers should not vary as a function of race: it should be equivalent towards both Black and White drivers.
This logic then yields a test for officers’ degree of own-race bias. If the increased punitiveness of White officers is only present towards non-White drivers (i.e. the difference-in-differences estimate is above zero), the empirical strategy would indicate evidence of officer own-race bias.
Applying the difference-in-differences strategy reveals that a Black (Hispanic) driver who is randomly assigned a White officer is 1.75 (2.96) percentage points more likely to be cited relative to a White driver who is randomly assigned a White officer. Thus, officer own-race bias can sometimes serve a decisive factor in determining whether a driver is cited in a vehicle crash investigation.
To explore the nature of this own-race bias further, the author focuses solely on citations issued for nonmoving violations (e.g. expired license tags). Because officers can objectively verify whether these violations have taken place, own-race bias in the context of nonmoving violations would yield fascinating insights:
Own-race bias would reflect discrimination via leniency rather than harshness. If officers falsely alleged that drivers of a different race committed nonmoving violations, such drivers would easily be able to refute officers’ claims by presenting the necessary paperwork or demanding that officers scan the plates in their system. Thus, the only plausible mechanism by which officers can exhibit own-race bias is by ignoring nonmoving violations committed by drivers in their own racial group.
Own-race bias would reflect a preference for discrimination itself rather than a kind of false belief or desire to optimize some independent quantity. Because officers must verify drivers’ paperwork and plates when investigating the vehicle crash, own-race bias in the context of nonmoving violations should reflect an officers’ deliberate preference to ignore such violations committed by drivers in their own racial group.
The author ultimately confirms these insights by unearthing evidence of own-race bias in the set of citations issued for nonmoving violations:
There is significant racial bias in citations for both moving and nonmoving violations. Relative to the means for each category, the effect is much larger for nonmoving violations than for moving violations. Specifically, the racial bias in citations for nonmoving violations is around 14-15 percent of the mean.
It may be tempting to conclude from this finding that the study clearly supports the “Driving While Black” hypothesis. However, this conclusion would be premature as the author carefully (and intentionally) uses the phrase “own-race bias” rather than “anti-Black bias”. The reason for this verbiage is because the difference-in-differences strategy cannot demonstrate whether the observed own-race bias is driven by the behavior of non-White officers or White officers. Thus, the study is agnostic with respect to the “Driving While Black” hypothesis.
The Veil-of-Darkness Test
Pioneered by Grogger and Ridgeway (2006), the “veil-of-darkness” (VOD) test leverages the clever observation that the race of a driver is less visible after sunset, rendering it difficult for an officer to perform a traffic stop in a racially biased manner at night. This insight yields the following claims:
If officers are truly racially unbiased, the share of Black drivers stopped during the day should closely resemble the share of Black drivers stopped during the night (since officers cannot act on racial biases during the night).
If officers are racially biased against Black drivers, the share of Black drivers stopped during the day should exceed the share of Black drivers stopped during the night (since officers can act on racial biases during the day).
One might contest these claims by pointing out that commuting patterns are a function of time which, in turn, is correlated with the amount of daylight outside. For example, it could simply be that Black drivers are more likely to have work schedules that end earlier in the day, resulting in a greater share of Black drivers stopped during the day than during the night. The VOD test would then erroneously imply the existence of bias where none exists.
Grogger and Ridgeway (2006) account for this possibility by holding the time-of-day constant. They observe that some clock times can occur during daylight or darkness, depending on the day of the year. Thus, the authors can control for racial differences in commuting patterns by exploiting only the variation in daylight that occurs at the exact same time-of-day throughout the year, as shown in the figure below:

It cannot be denied that VOD has an obvious intuitive appeal. However, the test suffers from a number of flaws which may lead to misleading estimates of racial bias:
Vehicle Features:
There are a number of variables related to a traffic stop which correlate with visibility during the day time (e.g. broken tail-lights, expired license tags). If such variables are also correlated with race, VOD will provide a misleading estimate of racial bias. To see why, consider a case in which expired license tags are more common among Black drivers than White drivers. The share of traffic stops of Black drivers would then be lower at night than during the day not because of racial bias but rather because of police’s limited ability to visually detect expired license tags at night. Thus, VOD would incorrectly imply the existence of racial bias where none exists.
Anticipating Discrimination:
If Black motorists anticipate being discriminated against during the day, their daytime driving behavior will be different from their nighttime driving behavior. VOD will then underestimate racial bias because the share of Black drivers stopped during the day will decrease purely as a function of Black drivers being less willing to speed during that time. Kalinowski, Ross, and Ross (2021) lend credence to this possibility, discovering that Black drivers were less likely to speed and become embroiled in traffic accidents during daylight relative to nighttime. Importantly, the same was not true of non-Hispanic White drivers.
Patrolling Behavior
Kalinowski, Ross, and Ross (2019a) find evidence to indicate that officers change their patrolling behavior from day to night by shifting away from identifying speeding violations and moving towards identifying equipment violations. This raises the possibility that, during the night, officers are only looking to stop egregious speeding violators. Because officers’ priorities may be different between day and night, VOD could yield a misleading estimate of racial bias in stops for speeding violations.16
Seasonality Bias
Commuting patterns are often governed by changes in the seasons because drivers may change their behavior when school is out during the summer or when inclement weather shuts down roads during the winter. If Black and White drivers engage differently with seasonal trends, the share of Black drivers stopped during the day may differ from the share of Black drivers stopped during the night for reasons unrelated to racial bias.
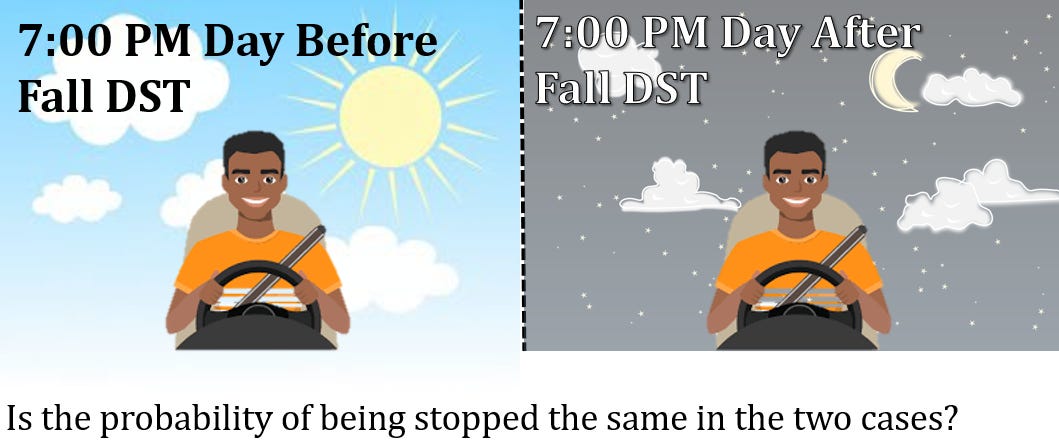
One common approach to deal with seasonality bias is to restrict the dataset to the period immediately surrounding the imposition (or retraction) of daylight savings time (DST). DST drastically changes driver visibility at the same time-of-day. In other words, a driver could easily be visible during some time period immediately prior to daylight savings but not be visible at all during the exact same time period immediately following daylight savings. Because there are fewer seasonal changes in the narrow time-window around DST, this stricter version of the VOD computes an estimate of racial bias that is less affected by seasonal trends in driving behavior, as shown in the figure below:
However, Kalinowski, Ross, and Ross (2019b) highlight two problems with the DST test:
Restricting the dataset to the period just around DST decreases the variation in daylight for each time-of-day in the dataset. Recall that, under the original formulation of VOD, the test exploits the fact that the amount of daylight at a given time-of-day can vary a lot over the court of an entire year. But if you restrict the sample you’re examining to just the time period around DST, you’re also eliminating a decent chunk of variation in daylight that occurs for each time-of-day being examined, leading to an increase in what researchers refer to as measurement error. Measurement error increases because less variation in daylight will render it more difficult to know whether daylight actually guarantees the visibility of driver’s race. Measurement error is problematic because it mathematically leads to an underestimate of racial bias.
Restricting the dataset to the period around DST may not even fully eliminate seasonality bias. Because the period around DST involves rapid changes from one season to the next (spring to summer, fall to winter), seasonality might still be an issue.
The authors present an alternative model to remedy these issues which is discussed later in this essay.
Driver Visibility
VOD implicitly assumes that the amount of daylight at a given time-of-day is an accurate indicator of whether a driver’s race is visible to an officer. But this assumption can be violated under a number of conditions:
If lights on the road enable officers to detect driver’s race at night, officers will be able to act on racial biases both during the day and during the night. VOD will then underestimate discrimination because the share of Black drivers stopped at night will resemble the share of Black drivers stopped during the day. Horrace and Rohlin (2016) demonstrate that controlling for sources of light on the road can have profound impacts on findings of racial bias.
If driver visibility is a function of additional weather conditions (e.g. fog), the amount of daylight will erroneously imply that the driver’s race is visible to an officer when it’s not.
Despite the plethora of VOD-studies that abound in the literature, there are none (as far as I know) which account for all of the aforementioned problems. Given this reality, the only VOD-studies which might be reliable are those which find evidence of racial bias despite suffering only from flaws that underestimate bias or those which find evidence of no racial bias despite suffering only from flaws that overestimate bias. Though I was unable to find an example of the latter, I found examples of the former which are described in more detail below.
Ritter (2017):
In 2002, the Minneapolis Police Department recorded information on every single traffic stop carried out by the department as part of a state-sponsored study. Each stop is accompanied by information regarding driver race (as observed by the officer), time and date, reason for why the stop took place, and, if a search took place, the reason for the search and the outcome of the search.
The author subsets the data to include only those stops which occur between 5:00 PM and 9:00 PM, resulting in a dataset comprised of roughly 10,000 stops. The author then examines whether the share of stopped Black drivers varies as a function of daylight visibility, holding time-of-day and month-of-year constant. Controlling for time-of-day and month-of-year decreases the chance that the analysis is confounded by racial differences in commuting patterns across a given day or year, respectively. The paper states:
The results indicate that the share of stopped drivers who are black is between 5 and 7 percentage points lower during darkness … The effects are quite robust to the inclusion of time-of-day and month controls. There seems to be little doubt that there was racial bias in traffic stops during 2002.
The author performs two robustness checks to ensure that this evidence of racial bias is not simply a false positive.
The author restricts the dataset to the time period surrounding DST and finds that the share of stopped drivers who are black is roughly 20 percentage points (±5.1 percentage points) lower during darkness. Notably, the DST test finds even stronger evidence of racial bias despite suffering from problems that would normally lead to an underestimation of racial bias.
Evidence of racial bias could be a false positive if officers are stopping Black drivers on the basis of vehicle characteristics that are both correlated with race and visibility. To account for this possibility, the author excludes all stops conducted for nonmoving violations (e.g. expired license tags) and reapplies VOD. The results remain quantitatively similar to the initial results, demonstrating that the bias observed cannot be explained away by officers rightfully stopping Black drivers on the basis of peculiar vehicle characteristics.
Interestingly, the author extends VOD to examine whether officers’ decision to search a vehicle is consistent with the racial bias displayed in the earlier decision to stop the vehicle. The extension of VOD rests upon the following argument:
It’s easier for officers to engage in racially biased traffic stops of Black drivers during daylight than darkness.
Because Black drivers during the day are more susceptible to officer racial bias, officers hold these drivers to a higher standard of behavior relative to Black drivers during the night.
Because Black drivers stopped during the day are held to a higher standard of behavior, Black drivers stopped during the day are less suspicious than Black drivers stopped during the night.
Because Black drivers stopped during the day are less suspicious than Black drivers stopped during the night, the share of searched drivers who are Black should be lower during the day than during the night.
Conclusion: If there’s a lower share of searched drivers who are Black during the day than during the night, then officers’ decision to search the vehicle will be consistent with the racially biased decision-making they used to initiate the stop.
Notably, VOD reveals evidence that contradicts this conclusion: the test does not indicate that a lower share of searched drivers are Black during the day relative to the night.17 Thus, the study highlights an inconsistency in officers’ decision-making.
The author explains this inconsistency by positing that:
The time pressure and cognitive load involved in initiating a traffic stop leads officers to rely on racially biased heuristics.
The lack of time pressure involved in conducting a search leads officers to adopt a more rational and deliberate mode of thinking that is free from racial bias.
Thus, the study lends credence to the “Driving While Black” hypothesis only in the case of traffic stops. Importantly, the estimates of racial bias in stops presented here could be underestimates because they fail to control for sources of lighting on the road and Black drivers’ anticipation of discriminatory behavior at the hands of police.
Kalinowski, Ross, and Ross (2019b):
Between 2010 and 2015, the Texas Highway Patrol conducted roughly 13 million stops for traffic violations. Each recorded stop contains information regarding the location of the stop, date/time of the stop, all violations associated with the stop, whether the violation(s) resulted in warning or citation, and identifying information for the officer who initiated the stop.
The authors focuses solely on stops that take place during the “inter-twilight zone”: the time period roughly around sunset where variation in daylight across days in the year is meaningful. They then restrict their analysis to speeding stops of non-Hispanic White drivers and Black drivers, decreasing the chance that the results are confounded by other types of violations which are correlated with both visibility and driver’s race (e.g. expired license tags).
The authors build upon the DST test to estimate the degree of racial bias exhibited in the decision to initiate speeding stops of Black drivers. Unfortunately, it isn’t really possible to explain the authors’ modifications without using econometric terminology, so the bullet points that follow are likely to be unintelligible to the average person.
The first issue with the DST test is the measurement error associated with restricting the time window to the period just around DST. To account for this measurement error, the authors use the DST change as an instrument for daylight. There is a nice mathematical proof presented here which demonstrates how the use of an instrument eliminates classical measurement error.
The second issue with the DST test is that it doesn’t fully eliminate seasonality bias since the seasons change quite rapidly around the period when DST is imposed (or retracted). To account for this issue, the authors employ a fuzzy regression discontinuity design where the discontinuity occurs at exactly on the day of DST. This strategy eliminates seasonality bias because the seasons merely change around the period of DST, not on the exact day.
The revamped model finds that speeding stops of Black drivers are 2.5-3.3 percentage points more likely to occur in daylight than darkness relative to a baseline of 13% during the inter-twilight zone. These findings lend credence to the “Driving While Black” hypothesis. However, even the revamped model may still underestimate racial bias because it fails to control for the presence of lights on the road and the possibility that Black drivers anticipate discriminatory treatment during the day.
The Hit-Rate Test
The hit-rate refers to the fraction of searches initiated by a police officer which successfully turn up contraband. Neil and Winship (2019) explain the hit-rate test like so:
The idea is that if one race exhibits a lower hit rate, this implies that their threshold for being searched [by officers] is lower, indicating discrimination.
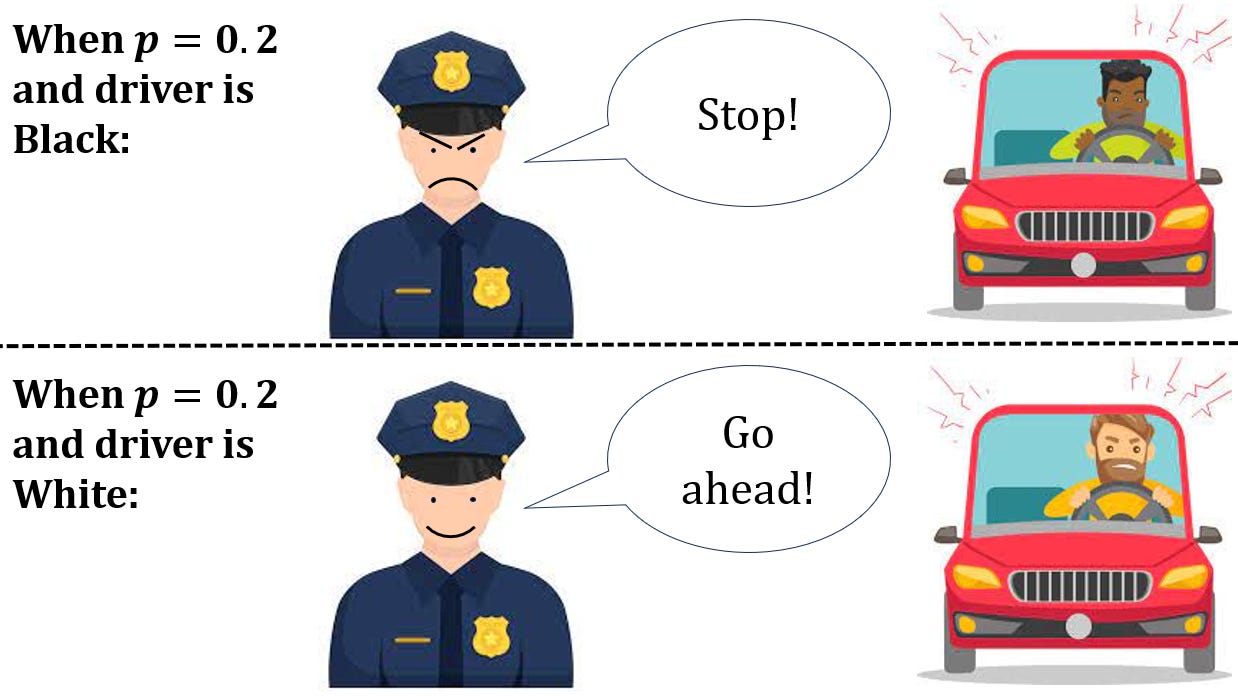
Let’s elaborate on this explanation further. Note that, when an officer stops a given driver, the officer perceives that the driver is carrying contraband with p probability. Each officer has a certain threshold probability t above which they initiate a search against a driver (and below which they do not search the driver).

Now consider a situation in which the threshold probability for Black drivers is lower than the threshold probability for White drivers. Under this condition, officers will be more willing to initiate searches against Black drivers on the basis of less-suspicious behavior than their White counterparts. Because Black drivers will be held to a higher standard of behavior, a lower threshold probability for Black drivers is indicative of anti-Black discrimination, as shown in the visual below.
Unfortunately, researchers cannot peer into the minds of officers and observe the race-specific threshold probabilities above which they initiate searches. Because of this limitation, scholars have historically relied on a strategy known as the hit-rate test to evaluate the existence of discrimination. The hit-rate test claims (key word: “claims”) to infer the race-specific threshold probabilities of searches from the hit-rates of drivers of a given race. It posits the following:
If the hit-rate for Black drivers is lower than the hit-rate for White drivers, the threshold probability for Black drivers is lower than the threshold probability for White drivers. Thus, anti-Black discrimination occurs.
Example: If 5% of searches of Black drivers turn up contraband and 10% of searches of White drivers turn up contraband, officers are holding Black drivers to a higher standard of behavior.
If the hit-rate for Black drivers is equal to the hit-rate for White drivers, the threshold probability for Black drivers is equal to the threshold probability for White drivers. Thus, no discrimination occurs.
Example: If 5% of searches of Black drivers turn up contraband and 5% of searches of White drivers turn up contraband, officers are holding Black drivers and White drivers to the same standard of behavior.
If the hit-rate for Black drivers is higher than the hit-rate for White drivers, the threshold probability for Black drivers is higher than the threshold probability for White drivers. Thus, anti-White discrimination occurs.
Example: If 10% of searches of Black drivers turn up contraband and 5% of searches of White drivers turn up contraband, officers are holding White drivers to a higher standard of behavior.
Despite its initial appeal, the hit-rate test has largely gone out of favor for two reasons:
The Infra-marginality Problem
Don’t let this big word scare you because this problem is fairly easy to explain. Consider the following graph where the x-axis refers to the probability that a driver is carrying contraband and the y-axis refers to the “share” of drivers carrying contraband at a given probability:18
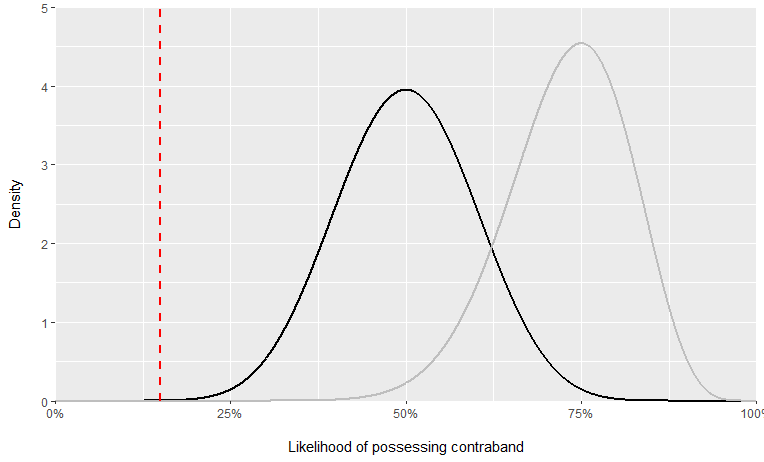
The lines on the graph carry the following meanings:
The red dashed line refers to the threshold probability at which officers initiate stops against drivers. Within this graph, officers employ the same threshold probability of 15% when searching Black and White drivers. Thus, no racial discrimination occurs.
The black-colored curve refers to the probability distribution of Black drivers carrying contraband. The Black hit-rate is the average of the distribution above threshold. It’s around 50%.
The gray-colored curve refers to the probability distribution of White drivers carrying contraband. The White hit-rate is the average of the distribution above the threshold. It’s around 75%.
Because the Black hit-rate (50%) is lower than the White hit-rate (75%), the hit-rate test implies the existence of anti-Black discrimination. However, this inference is clearly wrong since the same threshold probability was used to search Black and White drivers.
This issue with the hit-rate test is known as the infra-marginality problem. The name is derived from the fact that the hit-rates describe the average stopped driver whereas threshold probabilities describe the marginal stopped driver (i.e. the driver who is just above the threshold for being searched). Because the average stopped driver is not necessarily the same as the marginal stopped driver, the hit-rate test often yields erroneous inferences.
Omitted Payoff Bias
Doleac (2021) reviews the literature on racial bias in policing and describes a secondary problem with hit-rate tests: omitted payoff bias. The basic problem here is that researchers often assume that officers are only concerned with whether drivers are carrying contraband when initiating a search. However, officers might be attempting to maximize other types of outcomes such as arresting people for outstanding warrants. Thus, outcome tests would need to examine hit-rates along multiple dimensions to yield evidence of discrimination.
One study that addresses the infra-marginality problem is described below.
Pierson et al (2020):
Because hit-rates for the average driver cannot be used to infer the race-specific threshold probabilities, the authors of this study create a hierarchical Bayesian latent variable model (try saying that twice as fast) which directly estimates the race-specific threshold probabilities above which officers initiate searches against Black, Hispanic, and White drivers. The term “hierarchical Bayesian latent variable model” is pretty daunting, so let’s breakdown what this model is doing at a high-level.
Hierarchical models are applied in settings where data is nested in sub-categories of larger categories. Within this study, the term “hierarchical” refers to the fact that police stops and searches take place within counties nested within states (or districts nested within cities).
The term latent variable refers to two quantities: (1) police officers’ subjective assessment of the probability that a given driver carries contraband (2) the race-specific threshold probabilities that officers employ in deciding whether to search a driver. Because these quantities aren’t directly observable to the researchers, they are referred to as latent quantities (i.e. these are the quantities we want our model to estimate).
The term Bayesian refers to a branch of statistics where researchers incorporate their degree of belief regarding a particular phenomenon (also known as a “prior”) into a model which seeks to quantify the phenomenon in question.
I suspect that this last point about priors may be a source of irritation for some. One might argue:
If researchers can just incorporate their own beliefs about whether racial bias exists into their Bayesian model, how do we know that these researchers haven’t just “cooked the books” by incorporating a very strong prior in favor of the “Driving While Black” hypothesis into their model?
The authors provide three reasons to believe that they aren’t “cooking the books” in this way:
They explicitly outline all of the priors they place on parameters within their model. Importantly, their priors allow for rates of contraband-carrying to vary across race which should alleviate concerns about the authors simply assuming away any possible racial differences in contraband-carrying behavior.
The results remain unchanged when the authors re-compute the model with differently-specified priors.
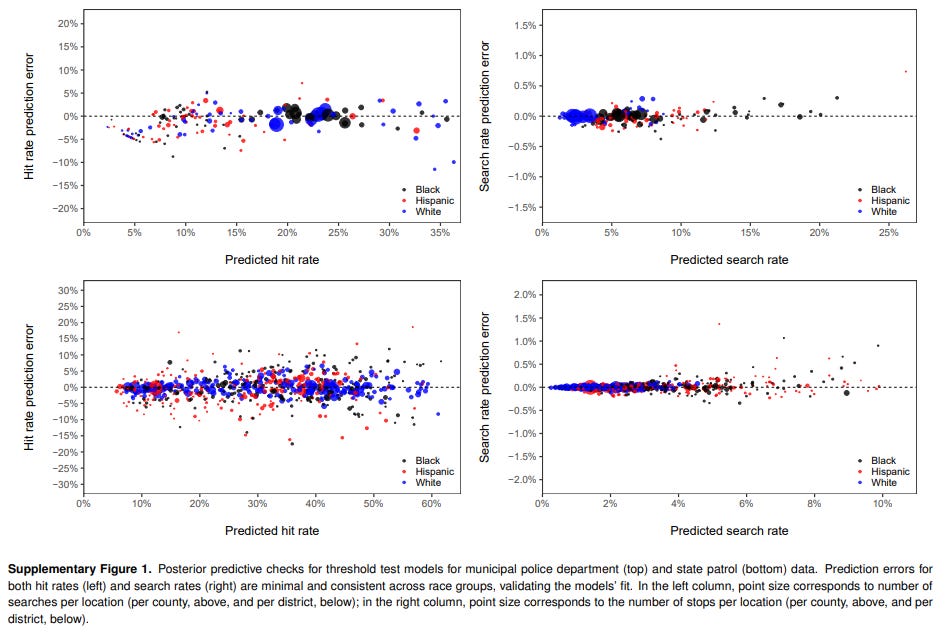
They conduct a series of tests known as “posterior predictive checks”. These tests examine the degree to which the model coheres with real-world observations. One might examine, for example, whether the model’s predictions regarding the frequency of searches by race are actually consistent with real-world search rates by race. The figure below demonstrates that the model’s results do, in fact, cohere with the real-world observed hit rates and search rates.

The hierarchical Bayesian latent variable model yields the following results:
Across cities, the threshold probability above which officers search White drivers is 10.0% compared to 5.0% and 4.6% for Black and Hispanic drivers, respectively.
Across states, the threshold probability above which officers search White drivers is 20.9% compared to 16.0% and 13.9% for Black and Hispanic drivers, respectively.
Because the threshold probability above which officers search Black/Hispanic drivers is lower than the threshold for searching White drivers, the hierarchical Bayesian latent variable model yields evidence of racial bias. However, the authors are careful to note several limitations of this model:
If search policies differ not only across, but also within, the geographic subdivisions we consider, then the threshold test might mistakenly indicate discrimination where there is none. Additionally, if officers disproportionately suspect more serious criminal activity when searching black and Hispanic drivers compared to white drivers (for example, possession of larger quantities of contraband), then lower observed thresholds may stem from non-discriminatory police practices.
To elaborate, there are two mechanisms by which the study’s model will provide misleading estimates of racial bias:
The model estimates race-specific threshold probabilities at the level of the county (district). This procedure effectively assumes that these threshold probabilities are uniform across officers in the same county (district). But if search behavior varies among officers within a given county (district), the model would be attempting to capture a wide variety of officer behaviors with only a single metric. This collapsing of multiple officer behaviors into one metric could then incorrectly imply the existence of racial bias that could otherwise be explained by an amalgamation of different types officers operating within a given county (district). This phenomenon is known as Simpson’s paradox.
Let us suppose that, among the set of drivers carrying contraband, Black drivers carry greater amounts of contraband relative to White drivers. If officers are optimizing not only for whether a driver has contraband but also the amount of contraband they’re carrying, officers might very well be justified in using different race-specific threshold probabilities to search Black and White drivers. This issue is an example of the omitted payoff bias described earlier.
Bearing these criticisms in mind, the study’s support for the “Driving While Black” hypothesis should be interpreted with caution.
Conclusion
If you’ve made it this far into the essay, I commend you! Learning about the strengths and weaknesses of each and every one of the studies presented in this essay is no easy task. We can end our journey by outlining some general trends that manifest across the studies described:
Racial bias is a geographically heterogeneous phenomenon. In the state of Florida, evidence of racial bias is fairly compelling (Aggarwal et al. 2022; Mello and Goncalves 2021). But in the city of Lafayette, LA, there’s little reason to think that racial bias motivates speeding stops of Black drivers (Quintanar 2017).
Racial bias mostly operates through discrimination via leniency. White drivers are under-stopped for speeding violations and more likely to have their speeding violations downgraded by officers (Lange, Voas, and Johnson 2005; Mello and Goncalves 2021). Officers are also more likely to ignore the nonmoving violations committed by members of their own race (West 2018).
Racial bias in traffic stops and searches may actually be greater against Hispanic drivers than Black drivers. Officers appear to search Hispanic drivers on the basis of less-suspicious behavior relative to both Black and White drivers (Pierson et al 2020). Officer own-race bias also impacts Hispanic drivers to a large degree relative to Black and White drivers (West 2018).
Racial bias is very difficult phenomenon to quantify. Though the studies described in this essay are among the most rigorous out there, even they may suffer from problems which can misestimate racial bias (Kalinowski, Ross, and Ross 2019a; Kalinowski, Ross, and Ross 2019b; Kalinowski, Ross, and Ross 2021; Neil and Winship 2019).
At this point, it might be tempting to simply tally up how many studies find evidence of racial bias vs how many don’t and then stake the truth of the “Driving While Black” hypothesis on which category has majority support. However, I would caution against this kind of interpretation because it doesn’t make sense to treat studies conducted in different areas of the country as though they’re examining the same hypothesis. Ultimately, the magnitude (and direction) of racial bias will naturally vary as a function of geography because policing practices are primarily determined at the local level. Thus, the truth of the “Driving While Black” hypothesis rests on the particulars of local context.
A Twist Ending?
While I was preparing to finalize this essay, I just so happened to encounter a study - Goncalves and Mello (2023) - on the topic of traffic enforcement.

I won’t dive deeply into the study methodology as the broader topic of deterrence in traffic enforcement is beyond the scope of this essay. However, I will note the following conclusion presented by the study:
Comparing motorists cited in the same beat-shifts by officers of varying stringency, we find that higher fines reduce the likelihood of a new traffic offense, a new speeding offense, and crash involvement in the following year.
I suspect the average reader might look at these results with a sense of nonchalance:
Great job Captain Obvious, you found a study which tells us that harsher punishments of traffic violations make people think twice about violating traffic laws. But what does any of this have to do with race?
The reason I highlight this study is because it demonstrates that discriminatory leniency shown towards White drivers might actually backfire by placing White drivers in more dangerous driving environments.
The upshot is that we would then need to oppose discriminatory leniency in policing not only because of the moral obligation to hold people to the same standard of behavior irrespective of race (which, to be clear, is more than reason enough) but also because such discrimination ironically undermines the safety of White drivers.19 Who would’ve guessed?
Works Cited
Aggarwal, P., Brandon, A., Goldszmidt, A., Holz, J., List J. A., Muir, I., Sun, G., & Yu, T. (2022). High-frequency location data shows that race affects the likelihood of being stopped and fined for speeding. Becker-Friedman Institute, Working Paper 2022-160. https://bfi.uchicago.edu/wp-content/uploads/2022/12/BFI_WP_2022-160.pdf
Baron, E. J., Doyle Jr., J. J., Emanuel, N., Hull, P., & Ryan, J. P. (2023). Racial Discrimination in Child Protection. NBER, Working Paper 31490. https://doi.org/10.3386/w31490
Cai, W., Gaebler, J., Kaashoek, J., Pinals, L., Madden, S., & Goel, S. (2022). Measuring racial and ethnic disparities in traffic enforcement with large-scale telematics data. PNAS Nexus 1(4). https://doi.org/10.1093/pnasnexus/pgac144
DiTraglia, F. J. (2021, August). Beyond Classical Measurement Error. econometrics.blog. https://www.econometrics.blog/post/beyond-classical-measurement-error/
Doleac, J. (2021). Racial Bias in the Criminal Justice System. In P. Buonanno, J. Vargas, & P. Vanin (Eds.), A Modern Guide to Economics of Crime. Edward Elgar Publishing. http://jenniferdoleac.com/wp-content/uploads/2021/07/Doleac_RacialBiasInCJ_chapter.pdf
Goncalves, F., & Mello, S. A Few Bad Apples? Racial Bias in Policing. (2021). American Economic Review 111(5) 1406-1441. https://doi.org/10.1257/aer.20181607
Goncalves, F., & Mello, S. Police Discretion and Public Safety. (2023). NBER, Working Paper 31678. https://doi.org/10.3386/w31678
Grogger, J., & Ridgeway, G. (2006). Testing for Racial Profiling in Traffic Stops From Behind a Veil of Darkness. Journal of the American Statistical Association 101(475) 878-887. https://doi.org/10.1198/016214506000000168
Grosjean, P., Masera F., and Yousaf H. (2023). Inflammatory Political Campaigns and Racial Bias in Policing. The Quarterly Journal of Economics 138(1) 413-463. https://doi.org/10.1093/qje/qjac037
Horrace, W. C., & Rohlin S. M. (2016). How Dark Is Dark? Bright Lights, Big City, Racial Profiling. The Review of Economics and Statistics 98(2) 226-232. https://doi.org/10.1162/REST_a_00543
Kalinowski, J., Ross, M., & Ross S. (2019a). Now You See Me, Now You Don't: The Geography of Police Stops. AEA Papers and Proceedings 109 143-147. https://doi.org/10.1257/pandp.20191026
Kalinowski, J., Ross, M., & Ross S. (2019b). Addressing Seasonality in Veil of Darkness Tests for Discrimination: An Instrumental Variables Approach. Human Capital and Economic Opportunity Global Working Group, Working Paper 2019-028. https://hceconomics.uchicago.edu/research/working-paper/addressing-seasonality-veil-darkness-tests-discrimination-instrumental
Kalinowski, J., Ross, M., & Ross S. (2021). Endogenous Driving Behavior in Tests of Racial Profiling. NBER, Working Paper 28789. https://doi.org/10.3386/w28789
KindelMedia. (2021). Police Officer Talking to the Driver of the Silver Car [Photograph]. Pexels. https://www.pexels.com/photo/police-officer-talking-to-the-driver-of-the-silver-car-7715237/
Lange, J. E., Johnson, M. B., & Voas, R. B. (2005). Testing the racial profiling hypothesis for seemingly disparate traffic stops on the New Jersey Turnpike. Justice Quarterly 22(2) 193-223. https://doi.org/10.1080/07418820500088952.
MacDonald, H. (2002, March). Profiling Myth Smashed. manhattan.institute. https://manhattan.institute/article/profiling-myth-smashed
Mello, S. (2023). Fines and Financial Wellbeing. Working Paper. https://mello.github.io/files/fines.pdf
Neil, R., & Winship C. (2019). Methodological Challenges and Opportunities in Testing for Racial Discrimination in Policing. Annual Review of Criminology 2 73-98. https://doi.org/10.1146/annurev-criminol-011518-024731
Pierson, E., Simoui, C., Overgoor, J., Corbett-Davis, S., Jenson, D., Shoemaker, A., Ramachandran, V., Barghouty, P., Phillips, C., Shroff, R., & Goel, S. (2020). A large-scale analysis of racial disparities in police stops across the United States. Nature Human Behaviour 4 736-745. https://doi.org/10.1038/s41562-020-0858-1
Quintanar, S. M. (2017). Man Vs. Machine: An Investigation of Speeding Ticket Disparities Based on Gender and Race. Journal of Applied Economics 20(1) 1-28. https://doi.org/10.1016/S1514-0326(17)30001-6
Smith M. (2017 June 20). Video of Police Killing of Philando Castile Is Publicly Released. The New York Times. https://www.nytimes.com/2017/06/20/us/police-shooting-castile-trial-video.html
Ritter, J. A. (2017). How do police use race in traffic stops and searches? Tests based on observability of race. Journal of Economic Behavior & Organization 135 82-93. https://doi.org/10.1016/j.jebo.2017.02.005
West, J. (2018). Racial Bias in Police Investigations. Working Paper. https://people.ucsc.edu/~jwest1/articles/West_RacialBiasPolice.pdf
Appendix
Publication Bias
One criticism a skeptic of the “Driving While Black” hypothesis might have of the aforementioned studies is the issue of publication bias. They might say:
Sure, it’s true that a decent number of studies found evidence of racial bias in traffic enforcement using methods that pass a basic sniff test. But how do we know that these studies haven’t simply been cherry-picked by academic journals to push a particular narrative?
I would normally try to answer this question by using various statistical methods to estimate the prevalence of publication bias (e.g. replication index, funnel plots). However, I found this to be a frustrating task in this context for a variety of reasons:
Pierson et al (2020) use Bayesian methods which places the paper at odds with the frequentist nature of commonly-used methods for detecting publication bias.
Lange, Voas, and Johnson (2005)20 and Aggarwal et al (2022)21 don’t provide sufficient information to compute p-values.
There’s substantial heterogeneity in the outcomes being measured by each of the studies: the probability of being issued a speeding citation, the probability of being issued citations in vehicle crash investigations, the probability of experiencing a vehicle search, and so on and so forth.
I had difficulty replicating the p-values that were reported in a few of the studies, though this lack of replication is almost certainly more likely to be due to my own inexperience than any fault of the authors.
In lieu of a formal statistical analysis of publication bias, I would simply challenge the reader to identify papers which meet the following criteria:
The study was not discussed in this essay
The study either has not been published in an academic journal or has very few citations if it has been published (i.e. it has been largely ignored by other academics)
The study provides strong evidence against racial bias in policing.
If a sizable number of papers meeting these criteria are brought to my attention, then I would be willing to re-evaluate my assessment of the credibility of the existing body of literature.
The Right Estimand
Quintanar (2017) and Lange, Voas, and Johnson (2005) both estimate the prevalence of racial bias by determining whether the following relation holds true:
In layman’s terms, these studies examined whether the share of drivers of a given race ticketed by police is equal to the share of drivers of that same race identified as speeding by speed-triggered cameras after controlling for the relevant characteristics (e.g. driving speed). If the two quantities are different from one another, the study would posit the existence of racial bias.
But one thing that initially confused me about this strategy is that, at least on the surface, this mathematical relationship didn’t seem to say anything about the actual estimand of interest:
This estimand represents the effect of being a particular race on one’s probability of being ticketed by the police, controlling for the relevant characteristics.
To bridge the gap between the mathematical relationship estimated by these studies and the estimand of interest, I sketched out an informal proof of sorts. I start with the following terms:
Let A denote
\(P(Black | Police, Controls) = \frac{P(Police | Black, Controls) \cdot P(Black | Controls)}{P(Police | Controls)}\)Let B denote
\(P(White | Police, Controls) = \frac{P(Police | White, Controls) \cdot P(White| Controls)}{P(Police | Controls)}\)Let C denote
\(P(Black | Camera, Controls) = \frac{P(Camera| Black, Controls) \cdot P(Black | Controls)}{P(Camera| Controls)}\)Let D denote
\(P(White| Camera, Controls) = \frac{P(Camera| White, Controls) \cdot P(Black | Controls)}{P(White| Controls)}\)
Let’s suppose that we do not find evidence of racial bias as defined by the studies’ criteria. Put another way, we assume A = C and B = D like so:
Let’s rewrite these equations using a little bit of algebra:
Before moving forward, note that the probability of driver being ticketed by a camera is equal across racial groups (conditional on the same controls) because cameras are unbiased measures of speeding behavior.
This equality allows us to claim the following about our estimand(s) of interest:
Thus, the studies’ criteria for establishing racial bias has a direct connection to the estimand of interest.
Moving from White Beat to Non-White Beat:
Negative binomial regression is a technique commonly used to model outcome variables that are exclusively non-negative integers. Because speeding stops can only be non-negative integers, Cai et al (2022) rely on the following negative binomial regression model:
The first term represents the average number of speeding stops while the second term represents the variance in the number of speeding stops. Because we are interested only in the average number of stops, we may discard the variance parameter. The rest of the relevant terms in the model are described below:
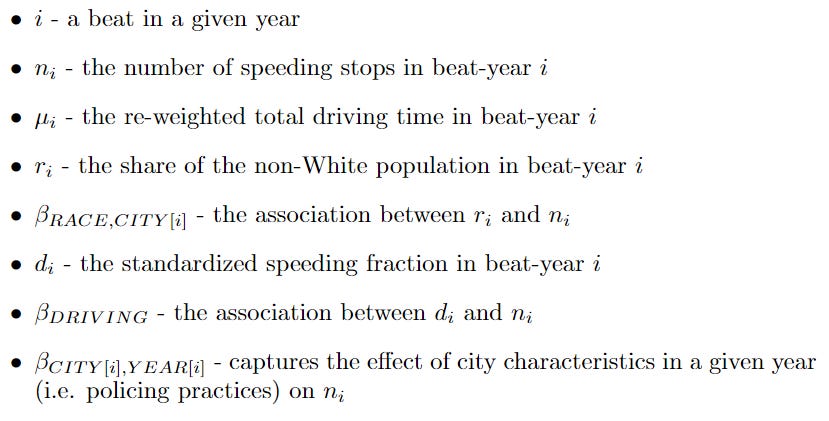
Let n_{W} represent the average number of speeding stops in a 75% White neighborhood and n_{NW} represent the average number of speeding stops in a 75% non-White neighborhood. We are interested in computing the percent change from n_{W} to n_{NW}:
To compute the effect of shifting the racial composition of a beat on the average number of speeding stops, we change the value of r_{i} while holding all other values constant. Thus, we can represent n_{W} and n_{NW} like so:
We can now derive the expression for the percent change in the average number of speeding stops associated with a move from a 75% White neighborhood to a 75% non-White neighborhood:
Using basic algebraic rules, it is easy to see that the above quantity simplifies to the following:
I anticipate that some may disagree with my characterization of the “Driving While Black” hypothesis. They might object:
The “Driving While Black” hypothesis doesn’t merely say that being Black increases the probability of being pulled over by the police. It asserts that Black drivers are stopped by police solely because they are Black.
I understand this objection but view it as unconvincing.
The quantity we ought to be interested in estimating is the causal effect of being Black on one’s probability of experiencing traffic enforcement at the hands of the police. Importantly, this causal effect could manifest in multiple ways.
On one hand, it could manifest in innocent Black drivers being pulled over by police because of crimes they never committed.
On the other hand, it could also manifest in Black drivers being pulled over at a higher rate than White drivers engaged in the same criminally-suspicious behavior.
Because we ought to be interested in capturing both dimensions of racial discrimination, I argue that the appropriate formulation of the “Driving While Black” hypothesis is one which asserts that Black drivers are simply held to a higher standard of behavior than White drivers as opposed to one which asserts that Black drivers are held to an impossibly higher standard of behavior than White drivers.
This essay is not intended to litigate the details of whether any singular allegation of racial profiling holds merit. Rather, it’s intended to survey the literature that quantifies the prevalence of racial bias at a macro-level.
The conclusions of the study remain unchanged when limiting analysis to those photographs where the race of the driver was unanimously classified.
Unfortunately, New Jersey does not disaggregate traffic stop records by violation type any further than moving vs non-moving violation. Because moving violations encompass behaviors other than speeding, it’s technically possible that the racial composition of drivers stopped for speeding is not equivalent to the racial composition of drivers stopped for moving violations, undermining the integrity of the study.
The astute reader might observe that White drivers are under-stopped under the following conditions: (1) only hours roughly between sunrise and sunset on the Northern segment (2) all hours of the day on the Southern segment. This finding might be explained by a combination of factors. It could be the case that officers are less likely to engage in pro-White bias on the Northern segment because officers are more concerned with identifying genuine speeding behavior on highways with higher speed limits. It could also be the case that the Southern/Central segment has better nighttime lighting than the Northern segment, enabling officers to act on pro-White biases on the Southern/Central segment during the nighttime. Regardless of what explanation is most consistent with the data, the basic problem for the “Driving While Black” skeptic remains: they cannot claim that the methodology employed by the study is sufficient to debunk the claim of racial bias without conceding that the same methodology yields evidence of pro-White leniency.
The study also has limited generalizability because the measurements were taken only during the summer months of the year. Thus, the study can’t shed light on the magnitude of racial bias during the spring, fall, and winter.
Because the telematics data may inadvertently contain greater levels of driving data for certain police beats relative to others, the authors give greater weight to driving time in more populous beats. This re-weighted total driving time is the “driving time” variable that’s actually used in the model.
The derivation of this formula is shown in the Appendix.
Though it’s certainly possible that civilians themselves could be racially biased in their decision to initiate a call-for-service, this result would imply that residents of non-White neighborhoods are biased against their fellow non-White community members: a conclusion that has vastly different implications for discourse around race and policing.
The unit of observation is known as a “driver-phase”. Each phase refers to one of three possibilities: the driver is searching for a passenger, the driver is driving to a passenger, or the driver is driving with a passenger to the destination.
Mello and Goncalves (2021) find that the racial composition of drivers involved in vehicle crashes roughly approximates the racial composition of drivers cited by the Florida Highway Patrol, leading them to believe that there is not racial bias in the initial decision to stop drivers. This finding calls into question the generalizability of Aggarwal (2022) to the broader civilian population in Florida.
I’m inclined to think that examining this relationship would likely not yield evidence of pro-White bias because the Black and White population constitutes 95% of the population of Lafayette, LA.
This statement should not be taken to imply the reverse (i.e. differential treatment by officer race cannot be used to imply the existence of discrimination). West (2018) utilizes this kind of methodology to identify the existence of racial bias in vehicle crash investigations.
Randomization of one group into two ensures that the two resulting subgroups, on average, have equivalent risk of the outcome of interest. Consider the simple example of choosing teams for a game of dodgeball. If teams are formed randomly, one would expect that, on average, the teams have equivalent skill. This property is why randomized controlled trials are often considered the “gold standard” study design to identify causal effects.
This explanation assumes that White officers are more likely to cite non-White drivers relative to non-White officers. This assumption is supported by descriptive statistics presented in Table 1.
Lange, Voas, and Johnson (2005) find evidence to indicate that Black drivers sometimes constitute a greater share of egregious speeding violators than White drivers. If, at night, officers only stop egregious speeding violators, we would expect the share of stopped Black drivers to be higher at night than during the day (assuming officers are unbiased). But note what necessarily follows from this claim: it would be possible for officers to act on racial bias yet still generate an equivalent share of stopped Black drivers during the day and night. This result is problematic because VOD argues that equality in the racial composition of drivers between day and night indicates no racial bias. Thus, VOD would incorrectly imply an absence of racial bias.
Only discretionary searches are examined because these searches are the only setting in which officers can act upon racial biases.
This graph is inspired by the discussion of the infra-marginality problem in Pierson et al (2020)
This would not be the first time that such a counterintuitive finding has been discovered. Baron et al (2023) note the following in the context of decisions to place children in foster care:
These results suggest white children may be harmed by “under-placement” in high-risk situations via the leniency that white investigators afford to white parents.
I understand that Lange, Voas, and Johnson (2005) do conduct statistical inference regarding whether Black or White drivers are more likely to speed. But this is not the type of inference that I’d need to carry out an examination of publication bias. Instead, I would need statistical inference regarding the causal effect of race on the probability of being stopped by a police officer. That information is not provided in the paper as far as I can tell.
I understand that Aggarwal et al (2022) states that their findings are statistically significant. But I was unable to find the specific statistical significance thresholds they used and the standard errors of the effect sizes they report in the paper.
Driver visibility also enables cops to detect offenses like drugs/contraband, seatbelt violations, or whether the driver has a warrant for their arrest. Blacks differ in all of these qualities, so an effect of driver visibility wouldn't necessarily even be one of discrimination.